
How to understand annuities – read before you jump

by Doug Brodie
In this blog:
[1] The up-to-date annuity rates.
[2] Our brand new fees explanation for clients.
[3] How share valuations are plucked from thin air.
[4] Wealth management = financial planning plus investment management.
[5] Japan – what the carry trade is, why it could sink Trump.
[6] The real £sd cost of adding ‘guaranteed’ to your pension? It’s here.
[1] Annuity rates, 7 September 2026
A 65-year-old with £100,000 can now buy £7,938 a year for life. Here is the full table, and what has moved.
Every month we price the same annuity for the same imaginary client, so that the numbers are comparable from one month to the next. He or she has £100,000, is in ordinary health, and is paid monthly in arrears. We price it at 60 and at 65, with and without a five-year guarantee, with and without a 100 % spouse’s pension, and either level or rising each year with RPI.
Yield equivalent is simply the annual income divided by the £100,000 purchase price. £7,938 divided by £100,000 is 7.94 %. It is not an interest rate, because the capital is gone, but it is the only sensible way to compare an annuity with the income a portfolio would pay you.
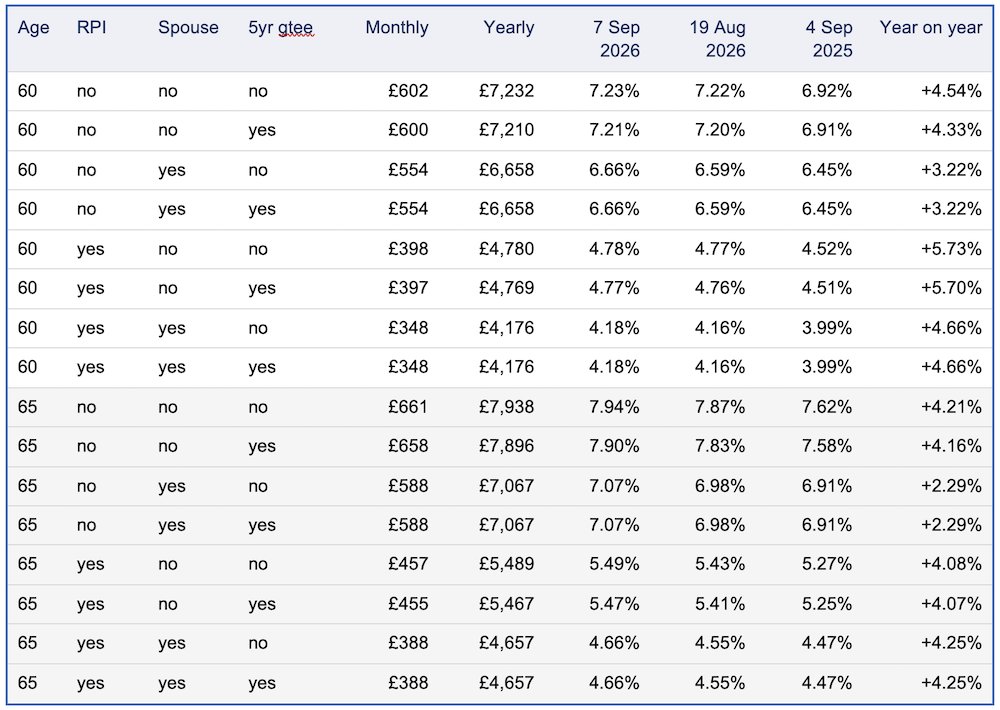
£100,000 purchase price, ordinary health, paid monthly in arrears. Spouse’s pension at 100 %. RPI rows rise each year with the Retail Prices Index. The three dated columns are the yield equivalent on each date; the final column is the change in income over twelve months.
What has moved
Rates rose in every one of the sixteen cases between 19 August and 7 September, a gap of under three weeks. The smallest rise was 0.10 %, the largest 2.28 %, for the inflation-linked annuity with a spouse’s pension at 65.
Over twelve months, every case is up between 2.29 and 5.73 %. The plain level annuity at 65 paid the equivalent of 7.62 % a year ago and pays 7.94 % today. On £100,000, that is £7,938 against roughly £7,620, an extra £318 a year for the rest of your life for having waited. Nobody can tell you in advance which way that cuts, which is one reason we rarely recommend buying an annuity with everything at once.
The reason is not complicated. Insurers back annuities with long-dated gilts and corporate bonds, so annuity rates follow gilt yields with a short lag, and gilt yields have risen. Item 5 in this week’s article explains one of the reasons why.
Three things worth noticing
First, the ten-year column in our working, which the table above summarises as yearly income. A level single-life annuity at 65 pays £7,938 a year, which is £79,380 over ten years. Nearly 80 % of the purchase price is back in your hands by 75, and the insurer is still on the hook for the rest of your life. At current rates, the arithmetic of an annuity is the best it has been in well over a decade.
Second, the five-year guarantee (this is not guaranteeing your capital or a return of your money, it’s guaranteeing that payments will be made for a minimum of five years). At 65, that ‘insurance’ costs £42 a year and at 60 it costs £22. For that, if you die in the first five years, the balance of five years’ payments continues to be paid. It protects you against dropping dead the day after buying the annuity.
Third, look at where the real money goes. A spouse’s pension and inflation-linking together take the 65-year-old’s income from £7,938 to £4,657. That is the subject of item 6, and it deserves its own post. That’s ‘real’ in terms of inflation affected, as opposed to nominal ignoring inflation. The 80- year-old you is dependent on the decisions you make today.
The usual caveats, which matter. These rates are for someone in ordinary health. Smokers (still?) and people with a medical history can qualify for enhanced rates that pay more, sometimes considerably more. Postcode matters too. Nothing here is a quote or a recommendation, and the right answer for you depends on what else you own and what your spouse would need. Our white paper data compares annuities back to back with trackers, 60/40 portfolios and investment trust natural income – the numbers are what they are.
[2] What we charge, and why. The new version.
We have rewritten our fees explanation from scratch. You can read the full fees and charges document here. It now starts with the number, and it runs to two pages. Here is what it says.
It is surprisingly hard to get a straight answer on what financial advice costs. Try it. Ring three firms, ask what they charge, and count how many sentences you get before a number appears. We would rather you knew before you picked up the phone, so from 1 September our fees are set out in a document that opens like this:
The Short Version
0.75% at outset. 1% a year. No VAT. Nothing else.
The rest of the document explains what those two numbers buy, who should not hire us, and what everybody else in the chain charges. I am going to walk through it here because I think the reasoning matters as much as the figures.
Our only income
The fees our clients pay are our only income. We receive nothing from platforms, fund managers or anybody else, so our only commercial interest is your wellbeing. Commission on pensions and investments has been banned since 2013, but it is still worth saying out loud, because the habit of wondering what the adviser is really getting out of it dies hard. We currently supervise client money on 11 different platforms, invested with 47 different asset managers, and have no financial relationship with any of them.
The initial fee: 0.75 %
One fee covers everything at outset: discovery, research, planning, your written recommendation, implementation and all the administration. It is 0.75 % of the funds you invest or transfer, with a minimum of £2,500. The 0.75 % applies to the first £2 million only, and zero above that sum. Three worked examples.
£400,000 invested: £400,000 x 0.75% = £3,000.
£250,000 invested: £250,000 x 0.75% = £1,875. That is below our minimum, so the fee is £2,500.
£3,000,000 invested: the first £2,000,000 x 0.75% = £15,000, our maximum, and the remaining £1,000,000 is charged at zero. Total £15,000.
For that, you get an in-depth discussion of your objectives, resources and intentions, for as long as you need. You will have a hundred questions. You get a comprehensive plan with a lifetime cashflow forecast, tested against market crashes, different rates of return, inflation, annuities and a long life, with the alternatives shown side by side. And you get a portfolio researched for you alone, built to deliver the income that pays for the life you lead. We track the time we spend so both of us can see the value, and we never charge by the hour.
The ongoing fee: 1 % a year
Our annual fee for supervision and review is 1 % of the funds invested. For a fund of £400,000 that is £400,000 x 1% = £4,000 a year, which is £4,000 divided by 12 = £333.33 a month. For £1,400,000 it is £14,000 a year. As a percentage, the amount rises as your fund grows and falls if values fall, which is as it should be.
Roughly half of that fee pays for regulation, compliance, levies, insurance and systems. The other half pays for your adviser and client manager, our research subsidiary and the training of your team. For it, we monitor the underlying assets every working day and run a cash and asset review for every portfolio every week. We handle all the administration. We provide a valuation every six months and your portfolio is online around the clock. We produce a full annual update reconciling every pound of income and capital, and we place no limit on calls or meetings, subject only to being fair and reasonable.
Who we are not
This is the section we are happy to write, because most firms won’t. We are the wrong firm for some people, and it’s fair to say so now. We do not run our own funds and we do not sell pre-made portfolios with risk labels. We do not do one-off projects, unless it is for a charity. We do not write financial plans for people who want to manage their own money. We do not do complex tax strategies, US tax in particular. And we are not the right team if your investable assets are below £250,000, though we may still be able to help with guidance. However, we do look after clients’ families irrespective of size, and kids go free. And if people need help, we won’t say no like a corporate.
What other charges are involved
Our fee is one line of three. You can’t pop into Fidelity and hand over £1,000 to walk away with fund units in your pocket. Your money always sits on a platform run by a product provider such as AJ Bell, Aviva, Fidelity or Standard Life, and their charge is usually between 0.15 and 0.25% a year. For that, they act as custodian, handle tax within your pension and ISA, buy and sell as we instruct, and make payments to you, including through PAYE for pension income. The investments themselves may carry annual charges. Shares carry none, investment trusts are usually 0.35 to 0.65 %, and trackers and ETFs can be as low as 0.07 %.
So, to put the whole picture in one place for a £400,000 portfolio, with the investment charge shown as an illustration only, because it depends entirely on what we build and a portfolio of directly held shares carries none:
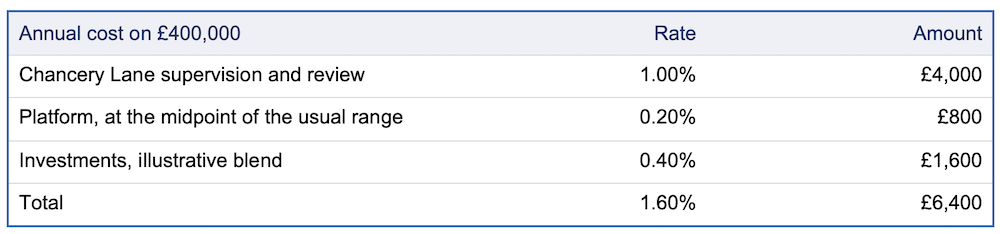
Illustrative. The investment line will be replaced with the actual figure for your portfolio before anything is committed.
We will always tell you the full annual charge, in pounds and pence, before anything is committed. Before we give any advice, we add together every cost and charge payable, ours and everyone else’s, so you see the whole picture in one place. You will never have a charge from us that you did not agree in advance.
Don’t believe all you read about charges.
When you pay money into a SIPP, ISA, GIA, it sits in cash till invested. You’ll always hold a cash balance for charges and costs. Big platforms then pool your cash with all the other customers and do deals with your money with banks, that are not disclosed to you. We call this interest rate ‘skimming’. In 2024 alone, the largest of these firms skimmed over £250,000,000 in interest from their customers’ cash. We think this unethical at least, and illegal at worst.
A very large direct sales firm sells its own badged funds and uses external investment houses to manage them – think Lazards, Schroders et al. The declared growth pension fund charge is 0.56%, which seems reasonable, however, it doesn’t mention that the sales firm also goes to the external fund managers running that fund and charges them as well – what you and I might describe as a kickback. So, when it says it charges X% for its pension, that’s correct, but it is deliberately not telling you the whole story, that’s not all it’s taking from your money. That can only be generously described as smoke & mirrors, or sleight of hand. Again, we think that is unethical and deliberately misleading.
Who holds your money, and who carries the can
Never us. You never make an investment payment to Chancery Lane and we never hold client money. Your investments are held by trustees and custodians who are separately regulated by the FCA. We are advisory, not discretionary, which means your money cannot be moved without you first receiving our reasons in writing and giving your written consent.
You are also paying for something easy to overlook: accountability. When we advise you, we keep responsibility and liability for that advice, and it does not expire when you sign the paperwork. Advice you can hold someone to account for costs more than information you cannot, and that is as it should be.
If we cannot add value to your position, we will tell you. Our clients are never locked in and are free to leave whenever they wish. The best way to find out is a free introductory chat.
[3] How share valuations are plucked from thin air

More than two-thirds of the American market’s return in the ten years to 2020 came from people agreeing to pay more for the same profits. That is not a return. It is an opinion. For value investors, the role of the stock market is only to tell us a price. It cannot tell us what the value of the company is.
That is a well-known value investor, and it is the whole of this post in two sentences. What follows is the evidence.
What a share return is actually made of
When a share goes up, there are only three things that can have happened. The company paid you a dividend, which is cash in your account. The company earned more than it did last year, which is a real change in the business. Or investors decided to pay a higher multiple for the same earnings, which is a change of mood. The first two are measurable. The third is plucked from thin air, and it can be un-plucked just as fast.
Topdown Charts, using LSEG and Robert Shiller’s data, has split the American market’s total return into those three parts for every decade since 1880. Each row below is the ten years ending in the year shown, and the figures are annual averages.
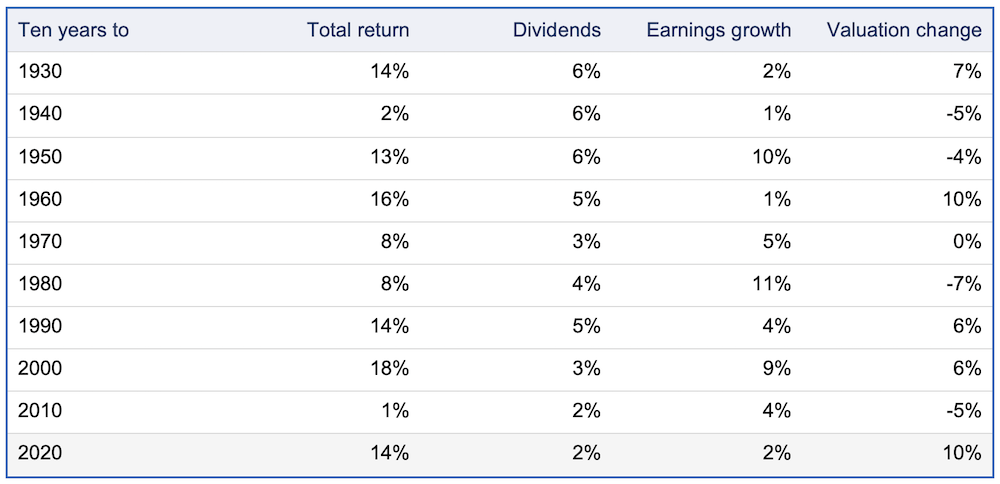
Source: Topdown Charts, LSEG, Robert J. Shiller data. S&P 500. Rounded. Earlier decades from 1880 omitted for space; the pattern is the same.
Read the last row slowly. In the ten years to 2020, the American market returned 14 % a year. Two points of that was dividends. Two points was earnings growth. Ten points, more than two-thirds of the whole return, was investors paying a higher price for exactly the same earned cash.
Now look at what has followed the other big valuation decades. The ten years to 1930 added 7 points from valuation; the next decade gave 5 back. The ten years to 1960 added 10; the two decades that followed gave back 0 and then 7. The ten years to 2000 added 6; the decade to 2010 gave back 5 and delivered a total return of 1 % a year, which is why people who retired in 2000 still talk about it. Valuation gains are not free - they are borrowed from the future.
Where the mood stands today
The American market was valued at 3.61 times its annual sales on 4 September 2026. The long-run average of that measure is 2.55 and the median is 1.65. The all-time record is 3.75, set earlier this year.
For the ratio to return to its average with sales unchanged, prices multiply by 2.55 divided by 3.61, which is 0.706, a fall of 29 %. To return to the median, prices multiply by 1.65 divided by 3.61, which is 0.457, a fall of 54 %. Sales grow, so some of that can arrive through years of flat prices, and nobody knows the timing. But those are the numbers.
Protect your income – dividend income is not correlated with capital values – that is counterintuitive and it’s how City of London has increased its dividend every year since 1966, when we were collecting World Cup Willie stickers.
Topically, Michael Burry, the investor made famous by his success in 2008 in The Big Short, is widely reported to be short a million shares of Nvidia (short – he’s sold them now, hoping to buy back later at a lower price). What is of interest is not the bet but the argument: he is not saying the shares are expensive, though they are at nearly 20 times sales. He is pointing at a weakness in the business: a handful of customers now account for the majority of what Nvidia is owed, the largest is paying more slowly while buying less, and the same customers are designing their own chips so as to need Nvidia less. This is an argument about value, whereas the share price is an argument about mood.
Unforced errors
As in tennis, so in investing. As we know from Mr Federer, most points are not won by the winner, they are lost by the loser. Buying an asset because its price has been rising is the unforced error of investing, and it is the one the rising tide encourages, because for a while it works, then the tide goes out. Read Charlie Ellis’ ‘Winning the Losers Game’.
If there is enough margin of safety, we don’t have to worry about the short-term fluctuations of the market at all.
This is why we build retirement income around the one part of the return that is not an opinion - dividends are cash. They arrive whether or not the next buyer is in a good mood, and you do not have to sell anything to receive them. Earnings growth is real too, but you only get paid for it when a company distributes it or when somebody else buys your shares. Valuation change is the part you cannot spend without finding that somebody. There is more on this, with the data, in the research we publish on chancerylane.net.
[4] Wealth management is financial planning plus investment management
Most of the industry does one or the other. Doing both, under one roof, with one person accountable for the income, is the whole point of what we do.
“Wealth management” is a phrase that has been stretched to cover almost anything, so here is the definition we work to: a financial plan tells you what income you need, when you need it, and for how long. Investment management is the business of producing that income. Wealth management is both halves, done by the same people, so that the plan and the portfolio are one thing rather than two.
What happens when the halves are split
A great deal of the advice industry is built the other way. A planner meets you, builds a cashflow forecast on an assumed total return of, say, 5 % a year, and hands the money to somebody else to run: a model portfolio, an outsourced discretionary manager, a set of risk-rated funds (which is why they allocate you a risk ‘number’). When the income the plan promised does not turn up, the planner explains that markets have been difficult, and the manager explains that the portfolio has performed in line with its mandate. Both statements are true. Neither of them pays your bills, and nobody is actually accountable for the number that mattered.
Our answer is to keep the two halves together. The plan states your income in pounds and pence, month by month. The portfolio is researched, by our own portfolio manager, to produce it. At every annual update, we show you, to the penny, what was actually generated against what we said. No blaming the markets, no twelve-month opinions. If the number is wrong, the person who told you the number is the person sitting opposite you.
Do the things you are good at, delegate the rest
A piece of advice I came across recently, aimed at people running small professional firms, applies just as well to retirement. Write down the fifteen things your role requires. Score yourself on your interest in each, high, medium or low. Score yourself on your ability in each, the same way. There will be perhaps three that are high on both counts. Do those, and find other people to do the rest.
That is what a client does when they hire us. Managing a retirement portfolio, chasing providers, reconciling income, keeping up with tax rules, monitoring 47 asset managers: for most people these are medium or low on interest and ability, and there is no shame in that. The high-highs of your retirement are elsewhere, on the golf course, with the grandchildren, in the garden, in whatever it is that you would do more of if the money were not on your mind.
It is also how we run the firm. The person who researches your portfolio does not also process the paperwork. The person who meets you does not also run the compliance. Everybody does the things they are high-high on, which is why the fees explanation in item 2 says that roughly half of what you pay us goes on the machinery and half on the people.
Objectivity is a habit
If we do things as objectively and rationally as possible in the little things in life, it can also help us to remain objective and rational in major investment decisions. If we don’t have the spirit of objectivity and rationality in our daily life, how can we guarantee that we will suddenly be objective and rational when making major decisions?
That is the same value investor quoted in item 3, and it is the best argument I know for financial planning as a discipline rather than a document. A plan is not a forecast. It is a way of thinking that you practise in small decisions so that it is there when you need it for a large one.
Marcus Aurelius got there two thousand years earlier, in his Meditations: “Very little is needed to make a happy life; it is all within yourself, in your way of thinking.” Financial planning cannot make you happy: it takes money off the list of things to think about, providing you with the financial independence to concentrate on what does make you happy. (It’s not money).
[5] Japan, the carry trade, and why it could sink Trump
America’s biggest creditor is being called home by its own central bank. That matters more to the White House than anything happening in Washington, and here is why.
What a carry trade is
For most of the last thirty years you could borrow Japanese yen for next to nothing. So investors did, in enormous quantity, and swapped the yen for dollars to buy things that paid more: American government bonds at 4 or 5 %, or American shares, or Nvidia. The gap between what you pay on the loan and what you earn on the asset is the “carry”. It is free money, with one condition: the yen must not rise. If it does, the loan costs more dollars to repay than you borrowed, the free money turns into a loss, and everybody who did the same trade heads for the same exit at the same time.
We have seen what that exit looks like. On 31 July 2024, the Bank of Japan raised its rate to 0.25%, the yen jumped, and on 5 August 2024 the Tokyo market fell 12% in a single day, its worst since 1987. American markets fell with it. The Bank for International Settlements later put the size of the carry trade at roughly 40 trillion yen, about $250 billion, with cross-border yen borrowing nearer 80 trillion yen, about $500 billion - that was just one quarter-point rise.
Where we are now
The Bank of Japan’s rate is now 1%, the highest for three decades. Japanese wages are rising at their fastest since 1997. Markets expect another rise this month and a further one by January. On 8 September the yen stood at 154 to the dollar, its strongest since February and up 3.25% in a month, on what Bloomberg described as a carry trade exodus.
Behind that move is something unusual. On 30 and 31 July, the United States and Japan intervened together in the currency market to push the yen up. Japan sold roughly $85 billion to buy yen; the Americans sold off euros to buy yen and did not say how much. Between late July and late August, Tokyo spent around $99 billion in total, and Japan’s foreign exchange reserves fell by a record $79.6 billion in August. The yen went from about 163 to the dollar to 155, drifted back to 159, and has since strengthened again on expectations of the rate rise.
Now ask the obvious question. When Japan sells $99 billion to buy yen, what exactly is it selling? Dollars, held where Japan keeps its dollars, which is in American government bonds – it’s selling off US government bonds.
The creditor and the debtor
Japan is the largest foreign holder of American government debt, with $1.24 trillion of Treasuries at the last count in February, out of $9.49 trillion held abroad. American government debt passed $40 trillion on 19 August 2026. The interest bill for the current financial year has already reached 1.27 trillion dollars at an average rate of 3.49 %, and it is now the second largest item in the federal budget after Social Security.
The sum that matters is short: one percentage point on the average interest rate on 40 trillion dollars is 40 trillion multiplied by 1%, which is $400 billion a year, every year, for nothing. The 30-year Treasury yield touched 5% earlier this year for the first time since 2007. In March, Japanese sovereign bond funds saw the largest monthly inflow in their history. The money is already going home, because Japanese investors are now being paid a respectable rate to keep it there, with no currency risk.
Why this could sink a President
A President can lean on his central bank to cut the short-term rate, and this one has. He cannot lean on the long-term rate, because the long-term rate is set by whoever turns up to buy the bonds. The biggest foreign buyer is being pulled home by its own central bank, has just sold tens of billions of dollars to defend its currency, and faces a domestic bond market paying more than it has in thirty years. Every dollar investor who ‘goes home’ has to be replaced by a dollar buyer who wants a higher yield. A higher long-term yield means a bigger interest bill, a higher mortgage rate and a heavier weight on the stock market, which are the three things this White House has staked its reputation on.
We think it’s stuffed.
Tariffs on Canada make headlines. A quarter-point in Tokyo does not. I know which one Washington is worrying about.
What it means from here
UK Gilt yields follow US Treasury yields, so if the long-term rate rises in America, it rises in Britain and that cuts two ways. Bond prices in your portfolio fall, and so does the value of any long-dated gilt fund. But annuity rates rise, which is part of why the table in item 1 has moved the way it has, and higher yields on new bonds mean higher income on what gets bought next. For an income investor, a higher yield is a better price, provided you are not forced to sell into it.
And for anybody holding a global tracker, remember that a chunk of it is Japanese, and that the yen moving 5% in a month is now a thing that happens – the value of the companies don’t change, the currency cost of their shares does.
[6] The real £sd cost of adding “guaranteed” to your pension
Guarantees are worth having. They are also expensive, and the price is paid up front in income you never see. Here are two sets of numbers that show exactly what it costs.
Every week somebody tells me their old employer’s final salary pension is the best thing they own. They are usually right - guaranteed for life, it rises with inflation, and it carries on for their spouse at 2/3rds. What they never see is the bill, because their employer paid it. So let us look at how much the employer and the employee have to pay into the pension to get those guarantees.
Part one: what the employer paid for the guarantee
The typical cost of a defined benefit pension in Britain runs at around 20% to 25% of salary a year.
The most recent survey figures for private sector schemes show employees contributing about 5% and employers about 16%, a combined 21% of salary. The Universities Superannuation Scheme, after its 2024 review, charges employers 14.5% and members 6.1%, which is 20.6%. For mature or underfunded schemes, the employer rate alone frequently exceeds 15% and sometimes goes well above 20%.
A defined contribution scheme, the kind almost everyone under 55 now has, typically sees total contributions of around 8.9 % of salary.
So the guarantee costs 21 % divided by 8.9 %, which is 2.36 times as much. Put another way, the difference of 21 minus 8.9, which is 12.1 % of salary, every year, for a working life, is the price of the words “guaranteed” and “inflation-linked” and “for your spouse too”. On a salary of £50,000, that is £50,000 x 12.1% = £6,050 a year. Over a 40-year career, before any investment growth at all, that is £6,050 x 40 = £242,000. Nobody saw it, because it never appeared on a payslip.
Contribution figures as supplied to us, citing Unison and the USS 2024 review. They vary by sector, scheme maturity and funding position, and should be treated as indicative.
Part two: what the insurer charges for the same words
If you have a defined contribution pot and want a guarantee, you buy an annuity, and the insurer prices each promise separately. This week’s annuity table in item 1 lets us read the price of each one directly. Take a 65-year-old with £100,000.
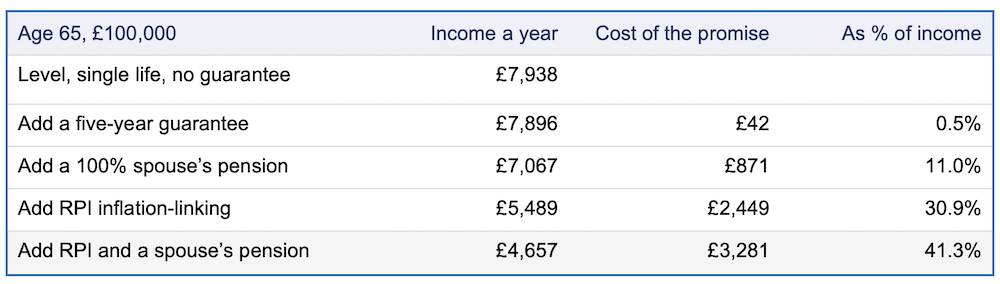
Rates as at 7 September 2026, ordinary health, monthly in arrears. Cost is the reduction from the level single-life income of £7,938. £7,938 minus £4,657 is £3,281; £3,281 divided by £7,938 is 41.3 %.
At 60, the story is the same. Level single life pays £7,232; with RPI and a spouse’s pension it pays £4,176, a cost of £3,056 a year, which is 42.3% of the income.
The five-year guarantee is nearly free, and you should have it. The spouse’s pension costs 11% of your income for life, and if your spouse dies first, you have paid for nothing; there is no refund. Inflation-linking is the expensive one, at 31% on its own.
When does inflation-linking pay for itself?
The RPI-linked annuity at 65 starts at £5,489 and rises each year. The level one is £7,938 forever. The question is how long before the rising one overtakes the flat one, and the answer depends on inflation.
If RPI runs at 3% a year, the RPI-linked annual payment catches up with £7,938 after about 12.5 years, at age 77 or 78. The working: £5,489 grows to £7,938 when 1.03 to the power n equals £7,938 divided by £5,489, which is 1.446, and n is 12.5. But that is only the year the payments draw level. By then you have received £2,449 less in year one, slightly less in year two, and so on.
Adding up every payment, the cumulative income from the RPI-linked annuity only overtakes the level one in year 25, at age 90.
At 2% inflation, the payments draw level after 18.6 years and the cumulative total catches up in year 37, at age 102. At 4%, the cumulative total catches up in year 19, at age 84.
Inflation-linking is insurance against high inflation and a long life. If you get either, it pays. If you get both, it pays handsomely. If you get neither, you have paid a third of your income for a promise that did not come good, and that was the honest price of buying certainty.
The uncertainty is available in trust dividend income. Just because it’s not guaranteed doesn’t mean it’s not likely to happen. You and I could have a serious medical episode that wipes us out before the end of today – not guaranteed it won’t happen, but likely it won’t.
And if your income increase didn’t happen to match inflation in one year, is that a problem? Inflation spiked at >11% in 2022 – no one’s financial life collapsed, we just dealt with it, how about you?
So what?
None of this says do not buy guarantees. Some of our clients should, and do. It says know the price, because it is large, and because the alternative is rarely explained alongside it, which is why you should read our white paper before making a decision.
The alternative is a portfolio built to pay natural income: the dividends, coupons and rents the holdings actually pay out. It carries no guarantee, and I will not pretend otherwise. UK dividends fell 44% in 2020 (but ‘our’ trusts didn’t), and a portfolio yielding 5% today may yield less next year. But the capital stays yours, the income is typically higher than the guaranteed alternative from the first day, and when you die your spouse inherits the whole portfolio rather than a percentage of your income. Both approaches have a place. Most of the plans we build use some combination, and the right proportions depend on your health, your spouse and what else you own.
The research behind the comparison, with the numbers over full retirements, is published free in our white paper – email us for a copy. Read it before you sign anything with the word “guaranteed” on it. You will still sign, sometimes, however you will know what it cost.
Book a no-obligation Income Discovery Meeting
020 7390 0670
Two hours, both spouses, no jargon, no pitch. We bring the coffee. You bring the questions.
🧠 Grey Matter Workout: Did you get it right?
The question:
What comes next in the sequence?
1 - 11 - 21 - 1211 - 111221 - ?
The answer: 312211
The sequence is created by describing the number immediately before it, as a classic look-and-say sequence:
1 → “one 1” → 11
11 → “two 1s” → 21
21 → “one 2, one 1” → 1211
1211 → “one 1, one 2, two 1s” → 111221
111221 → “three 1s, two 2s, one 1” → 312211
About the author
Doug Brodie is Founder and CEO of Chancery Lane Income Planners. He has specialised in retirement income for over thirty years and is Chartered with both the CISI and CII. This article is general information and not personal advice. Figures are illustrative and depend on individual circumstances. Tax rules can change. Capital is at risk, income is not guaranteed and can fall, and past performance is not a guide to future returns.