Turning Chinese

by Doug Brodie
In the 70’s and 80’s Japanese commercial businesses and large scale engineering were globally dominant alongside the US. As incompetence drove the UK car industry into dust, so Toyota and Datsun stole their lunch. From 1986 to 1991 Japan developed an asset price bubble in which both real estate and stock prices went through the roof, fed by monetary easing – in layman’s terms that simply meant the government made money easily and cheaply available. The government started hiking rates in May 1989, the Nikkei peaked in December that year, crashed, and did not recover to the prior value for 34 years.
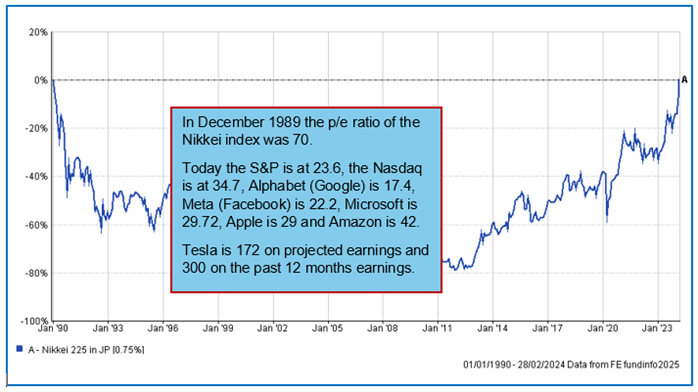
To understand the p/e ratio, what it says is the number of years profit that you pay for one share; that means, for example, that at current rates of profit Tesla would have to pay 100% of the profit generated to shareholders for the next 300 years to pay back the cost of the shares. The MSCI China Index is 15.8.
How about price to revenue? That is the share price as a multiple of the total revenue of a company: Tesla would have to pay you 100% of its revenue for the next 16.5 years. Another way to look at is investors are paying £16.50 for every £1 of revenue Tesla generates. Investors are paying £28.19 for every £1 of revenue that Nvidia makes.
Meanwhile in China, the country that processes 90% of global rare earths, the main index at a p/e of 15.8 is 33% cheaper than the US, so where do we see the future growth?
“China is the global leader in solar energy having surpassed 1,000 GW of installed photovoltaic capacity and installing more solar capacity than the rest of the world combined in the first half of 2025. This massive expansion is driven by policy and strategic investment, significantly contributing to the country's clean energy goals and leading to lower global costs for solar power due to China's dominance in manufacturing. “
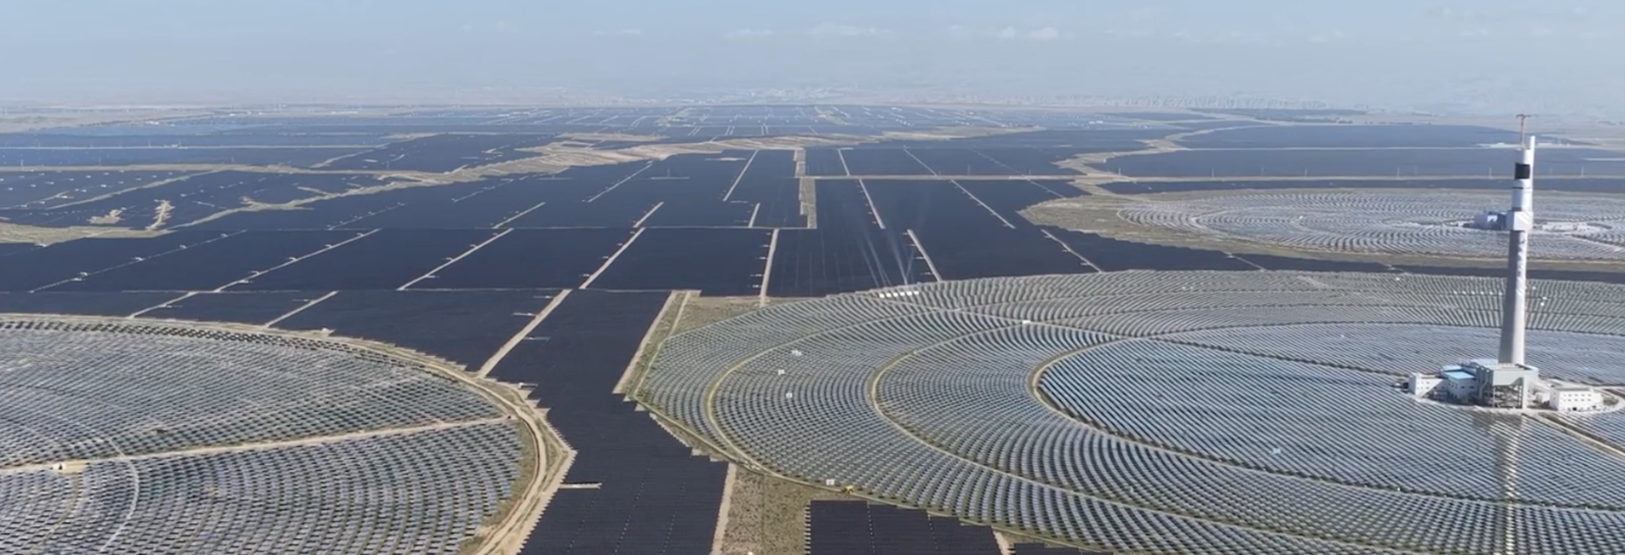
This is in Tibet at an elevation of 10,000 feet – the thin air allows the panels to soak up sunlight very efficiently. The coverage of this solar farm is seven times the area of Manhattan.

The Tibet power farm operates wind turbines that capture night breezes, and together with the solar they feed high voltage power lines that feed homes and businesses 1,000 miles away. China still burns as much coal today as the rest of the world put together, however Xi Jinping pledged to the UN for the first time, that China will cut its greenhouse gas emissions across its economy, and will increase its renewable energy sixfold in the coming years.
Meanwhile Donald Trump told the UN that climate change ‘is a scam’.
The Tibetan installation is the Talatan Solar Park, and it looks like this from the sky: that’s Manhattan on the left.

It currently generates c17,000 megawatts, enough to power 5 million households. As a reference, when Sizewell is completed it will have an output of 3,300 megawatts.
So, talking about nuclear, since 2013 the US has built two new reactors, Vogtle 3 and 4. In the same time period China built 13 and has a further 33 underway – all picked out by the NYT:
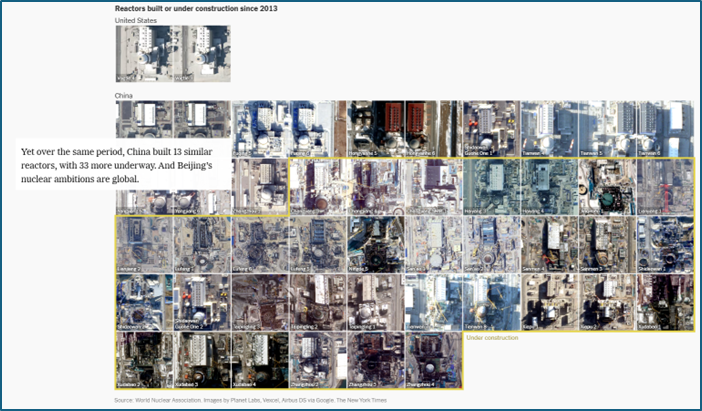
The NYT further reports that in five years’ time China’s nuclear output will have overtaken that of the US.

America also wants to expand its nuclear output, however it needs to catch up with the Chinese on both speed and cost: the differences are indeed stark.–
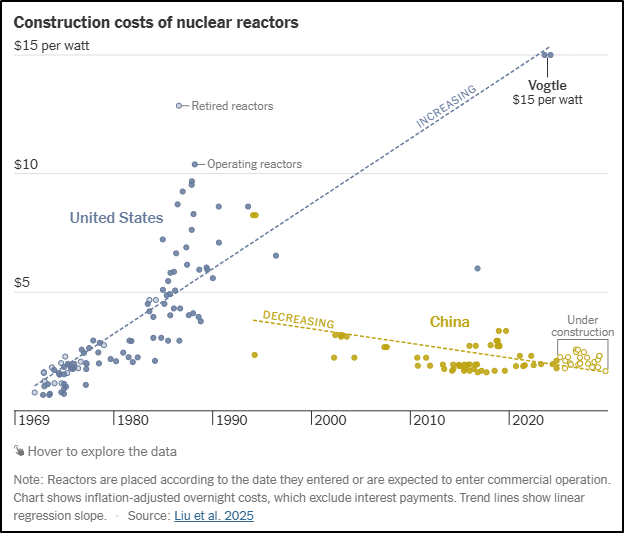
The trick to doing this, apparently, is that the Chinese have very few reactor types, so they just build them over and over again (and why not??), thus allowing developers to perfect the construction process, to scale efficiently and streamline the building costs.
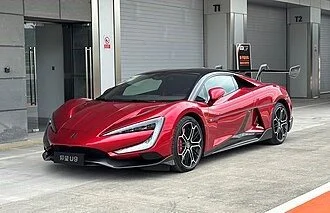
In 2023 China built 30.16 million motor vehicles whilst the US produced 10.61 million. China processes 90% of the world’s rare earths needed for - amongst other things - lithium batteries and electric car parts. For those of us who grew up with rubbish ‘Made in Hong Kong’ toys, it’s an eye-brow raiser to note that the world’s fastest production car is the Yangwang U9, clocked at 308 mph, and it looks like this:
China’s GDP is around $19 trillion with the US at $30 trillion so Rome is not dead yet; in 1960 China was just 11% of the US’ economy, and now it’s 64%.
China’s debt to GDP ratio is estimated at 96.3% versus the US at 122.5%, being a total of $38 trillion in the US and $19 trillion in China. The US is due to add a further $2.9 trillion debt this year, and China another $2.2 trillion. These are scary numbers, especially when one realises that if the debt from all China’s state owned enterprises is added their figure could be as high as 450%.
Rome might not have yet fallen, however the competition is very, very close.