The 4% Rule – recalculated for UK investors.


by Doug Brodie
[1] Why the 4% retirement rule fails in the UK: a 55-year reality check

When clients think about a “safe” rate of income to draw from their pension pots in retirement, the famous 4% Rule almost always enters the conversation. Originally established by William Bengen in 1994, this rule of thumb states that an investor can safely withdraw 4% of their initial portfolio value in year one, increase that amount by inflation every year after, and comfortably expect their money to last for 30 years.
However, Bengen's research was built entirely on US market data. When we replicated his exact chronological, year-by-year methodology within the UK macroeconomic landscape across a 55-year timeline, from 1970 to 2025, we uncovered a stark reality: the 4% rule is fundamentally unsafe for a UK personal pension.
Key findings at a glance
| Measure | Finding |
| US safe withdrawal rate | 4.0%. Bounded by the worst-case US retirement cohorts, this initial rate historically guaranteed 30 years or more of portfolio survival in America. |
| UK safe withdrawal rate | 2.8% to 3.0%. Owing to localised economic shocks, a UK retiree starting with a 4.0% withdrawal rate in the early 1970s would have completely run out of money in fewer than 22 years. |
| Optimal asset allocation | 50% to 75% equities. Holding fewer than 50% in shares fails to outpace inflation, while holding more than 75% introduces extreme sequence-of-returns risk during market downturns. |
Why is the UK safe withdrawal rate so much lower?
The baseline safety of a retirement portfolio is not determined by long-term market averages; it is determined by the specific sequence of returns a retiree experiences in their first few years of drawdown. The UK suffered a highly unusual economic cataclysm that was far more destructive than the conditions experienced in the US.
The 1973 to 1974 stagflation shock: the ultimate double whammy
Retirees who exited the workforce in 1972 or 1973 walked directly into a worst-case scenario. The UK equity market, via the FTSE All-Share, fell by over 60% in real terms.
Simultaneously, domestic inflation skyrocketed, 9.2% in 1973, 16% in 1974, 24.2% in 1975.
The straitjacket of trying to enforce a fixed withdrawal rate meant that from 1970 to 1974 the retirees’ capital had fallen by -26%, and at the same time the income demanded had risen by 58%, rising to 96% by the end of 1975. The massive 136% rise in the stock market that year restored the capital back to 100% of the 1970 value, but it now had to pay out almost 8% in income, twice the starting 4% rate.
This combination created a compounding trap: retirees were forced to dramatically increase their nominal annual cash withdrawals to maintain their standard of living, precisely while their underlying investments were being cut in half. This structural sequence forces the portfolio's effective withdrawal rate to spike out of control, causing permanent capital destruction.
The reality safety valve
Retirees don’t spend that way. They understand that excess pressure can have disastrous consequences.

In general, economists and actuaries think retirees insist on fixed income criteria mainly because their professional lives in the pension sector are based on modelling defined benefit schemes, and not fixed retirement pots that have no contractual income liabilities. Retirees simply cut spending when money is tight. If they had wanted inflexible incomes, they would have chosen annuities, not drawdown pensions.
The fallacy of unprotected income (95% equity, 5% cash)
A common counterargument is that retirees can avoid running out of money by tilting aggressively into shares. To test this, we modelled a hyper-aggressive portfolio composed of 95% FTSE All-Share and 5% cash:
The volatility trap: for the 1973 cohort, an initial 3% withdrawal rate on a 95-5 portfolio triggered absolute insolvency within 18 years, by 1990.
The balanced advantage: a standard, balanced 60-40 portfolio extended that same cohort's lifespan to 26 years.
Why it fails: in a severe multi-year downturn, a 5% cash buffer is burned through almost immediately. Once empty, the retiree is forced to liquidate volatile equities at absolute market bottoms, locking in permanent losses. Downside protection via gilts and bonds early in retirement is vastly more critical to fund longevity than high-beta upside acceleration.
Re-thinking capital preservation versus income stability
We also explored an alternative scenario: what if a retiree uses a 95-5 equity portfolio, but dictates that the core capital base must strictly keep pace with inflation, measured by RPI, rather than the annual income tracking RPI?
Mathematically, this forces a fascinating but highly impractical shift: permissible income becomes tied entirely to the portfolio's actual real return, that is, total return minus inflation.
Extreme income swings: if the market experiences a boom year, such as 1975, the retiree can draw a massive, windfall distribution, over 1 million pounds on a 1 million pound initial pot.
Mandatory capital injections: if the market drops or fails to beat inflation, the permissible income turns negative. For example, a 1973 retiree under this mandate would have been hit with a cash call requiring them to personally inject over 1.12 million pounds of fresh out-of-pocket capital back into their pension across their first two years, just to protect the principal floor.
Takeaways for modern retirement planning
If you really want a one-off decision that will deliver reliable income for life, use an annuity.
Separate income from capital to insulate income from stock market volatility.
Ditch the 4% assumption for UK retirees. Relying on US-centric metrics introduces a dangerous layer of structural risk to UK personal pensions. Real safety in the UK sits closer to 2.8% to 3.0%.
Embrace the equity volatility because low equity allocations cannot beat inflation over the long term.
Avoid unmanageable sequence risk at the start of retirement by only using natural income.
Prioritise income stability over capital floors. Designing a drawdown strategy around strict capital preservation leads to chaotic cash flows and unexpected capital requirements.
True retirement security for an individual relies on two simple actions: anchor withdrawn income to income generation that is separated from market volatility, and do not blindly attempt to force income to match one-off inflation spikes.
The simple method preferred by Chancery Lane is to use investment trusts, as these are custom-designed to be invested in equity for inflation protection, and with an inbuilt income buffer that separates income payments to retirees that removes sequence risk entirely. It’s worked since the start of the industry in 1868.
This is our own original, peer-reviewed research, published here on our website. The figures above are drawn from our 1970 to 2025 dataset and, as with all our work, the underlying return and inflation inputs are verified against primary UK sources before publication.
[2] Private credit funds bolt the doors
While the headlines this month celebrated record markets and enormous sums raised for artificial intelligence, a quieter and more sobering story was unfolding. Some of the largest investment houses in the world began refusing to let their investors take their own money out.
First, a definition in plain English. A private credit fund lends money directly to companies, the way a bank does, but the money comes from investors like you rather than from a bank's deposits. You hand over your capital, it gets lent out to businesses at attractive interest rates, and you collect the income. The pitch was simple and seductive: bank-like yields, dressed up as something more sophisticated, and sold to ordinary investors as a slice of the returns the big institutions enjoy.
The catch is the one that always hides in these things. The loans are locked up for years, but investors were told they could have their money back at regular intervals. That works fine until everyone asks for their money at once, at which point the fund simply will not let them have it. That is what “capping withdrawals” or “gating” means. The door you were told was open turns out to have a bolt on it, and the fund decides when to slide it across.
In the space of a few days, this is exactly what happened across the industry.
Source: Financial Times
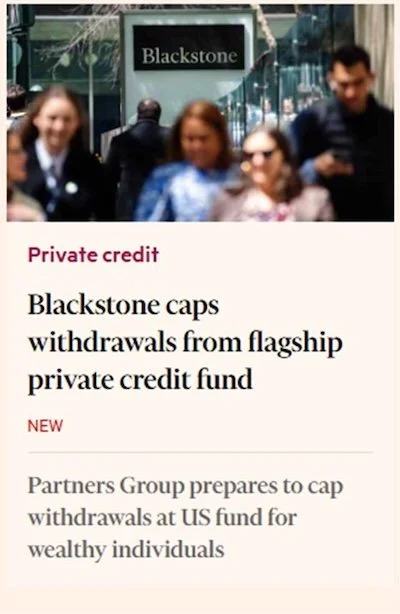
Blackstone, the largest of them all, capped withdrawals at its flagship private credit fund after redemption requests reached around 10% in a single quarter, double the 5% it permits. It was the first time the firm had used that mechanism on this fund.
Source: Financial Times
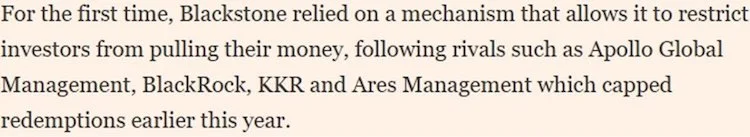
Blackstone was not alone, nor even first. Apollo, BlackRock, KKR and Ares had all capped redemptions earlier in the year. And the strain then spread from private credit into private equity, with Partners Group moving to restrict withdrawals from its flagship fund for wealthy individuals.
Source: Financial Times
Between them, these houses hold tens of billions in such funds. The lesson for the ordinary retiree is not panic, it is principle. An investment you cannot sell when you need to is not as liquid as it looked on the brochure, however attractive the yield. Liquidity (the simple ability to get your money back when you ask for it) is worth a great deal, and it is rarely priced in until the moment it disappears. As most retirees know, it’s return of your money that’s more important than return on your money.
Note: The images above are reproduced from the Financial Times and are shown for commentary purposes.
[3] How dividends grow your money
“I’m not ready to retire, so it’s too early to invest for income.”

Your pension is a tree: be patient, your income will not grow overnight.
If there is one idea in this blog worth pinning above the kettle, it is this one. The return you earn from shares comes from two places: the price going up, and the dividends the companies pay you along the way. Most people watch only the first and quietly ignore the second. That is a costly habit, and here is why.
Price alone tells less than half the story: the FTSE 100 1984 to 2026
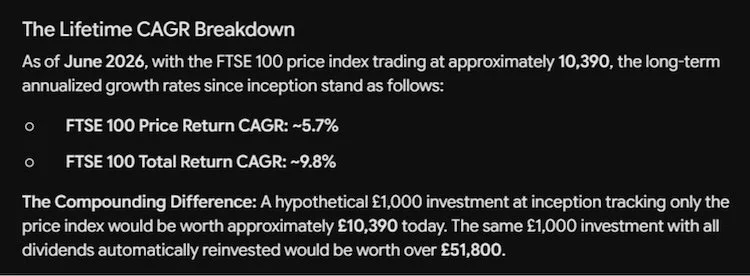
Take the FTSE 100 itself. As at June 2026, with the index at approximately 10,390, the long-term annualised growth rates since the index began look like this:
Price return only: around 5.7% a year.
Total return, with dividends reinvested: around 9.8% a year.
That gap, 5.7% against 9.8%, might not sound dramatic. Over a lifetime it is enormous. A hypothetical £1,000 invested at the index's inception, tracking the price alone, would be worth around £10,390 today. The very same £1,000, with every dividend automatically reinvested, would be worth over £51,800. Same index, same period, same starting sum. The difference, more than £40,000, is dividends doing their quiet work, year after year.
Source: Chancery Lane Research
Why reinvesting dividends is such a powerful strategy
Buying good, reliable dividend payers and reinvesting the income does three things at once, and each one quietly compounds the others.
It gives you pound cost averaging for free. Every time a dividend is reinvested, you buy more shares at whatever the price happens to be that day. When markets are low, your dividend buys more shares; when high, fewer. Over time, this smooths your average purchase price and takes the guesswork, and the emotion, out of timing the market.
It makes the growing dividend a larger and larger part of your return. Good companies tend to raise their dividends over the years. As those rising payments buy ever more shares, which in turn pay their own dividends, the income component of your return grows from a trickle into the main event.
The superpower of the total return framework becomes visible during severe bear markets. When stock prices collapse, stable corporate dividend payouts act as a mechanical buffer. Crucially, automatically reinvesting these cash flows allows investors to engage in "dividend harvesting" — buying more index units at distressed valuations, which fundamentally accelerates recovery timelines.
It hands you a simple switch for retirement. While you are still working, you reinvest. When you retire, you simply stop reinvesting and start spending the dividends instead. The capital stays invested and intact, and you live off the income it throws off. No need to sell a single share at the wrong moment.
Yield on cost: the number that grows while you sleep
Here is the idea that brings it all together. Yield on cost measures the income a holding pays you each year, expressed as a percentage of what you originally paid for it, not its price today. As a company raises its dividend over the years, your yield on cost climbs, even though you paid your money long ago and have done nothing since.
Yield to cost: you invest £100,000, paying just that once for your investment; your income in future years is measured against what you paid originally – not what today’s investment value happens to be.
The table below shows the yield on cost achieved by a selection of well-known UK income investment trusts, measured over 5, 10, 15 and 20 year holding periods. In plain English: it shows what the annual income had grown to, as a percentage of the original purchase price, for an investor who bought and held, with the dividends reinvested. As you wait in the last years in the run-up to retirement, buying the income stream and reinvesting makes the income you eventually take much more predictable than leaving the pension in capital alone.
| Investment trust | 5 years | 10 years | 15 years | 20 years |
| City of London | 6.9% | 8.2% | 13.3% | 18.6% |
| Dunedin Income Growth | 5.8% | 9.3% | 12.0% | 15.7% |
| Henderson Far East Income | 11.0% | 16.7% | 18.6% | 34.2% |
| Henderson High Income Trust plc | 9.4% | 10.1% | 19.1% | 20.8% |
| Invesco Bond Income Plus | 8.3% | 11.3% | 15.6% | 21.7% |
| Law Debenture | 6.0% | 9.8% | 16.1% | 24.1% |
| Lowland | 6.7% | 7.0% | 13.7% | 15.9% |
| Mercantile Investment Trust | 3.6% | 5.5% | 10.8% | 15.4% |
| Merchants | 7.9% | 10.5% | 14.4% | 17.9% |
| Murray Income | 5.7% | 8.6% | 11.3% | 14.6% |
| Murray International | 6.5% | 11.0% | 12.0% | 23.8% |
| Temple Bar | 9.2% | 10.0% | 14.1% | 19.7% |
| Average | 7.26% | 9.83% | 14.24% | 20.21% |
Source: Chancery Lane Research, yield on cost as at 31 December 2025.
The Rule of 72: how fast does your income double?
The Rule of 72 is one of the most useful pieces of mental arithmetic in all of investing, and you can do it on the back of a napkin. To find roughly how many years it takes for something growing at a steady rate to double, you simply divide 72 by that rate.
Apply it to the income from these trusts. Take Dunedin Income Growth, highlighted in the table above: after five years of holding, its yield on cost stood at 9.3% because over that period the dividend grew at 8.33%. If that income stream keeps growing at around that pace, the Rule of 72 tells us how long until it doubles:
72 ÷ 8.3 = approximately 8.7 years
In other words, an income already yielding 8.3% on what you paid is on course to double to roughly 18.6% on cost within about nine years, then to keep climbing from there. You can see that pattern playing out in the table itself: across these trusts the average yield on cost roughly doubles between the 5 year and 15 year columns, from 7.26% to 14.24%, exactly the kind of doubling the Rule of 72 predicts for income growing at this sort of rate.
That is the quiet magic of holding good dividend payers for the long term. You do nothing, and the income you receive on your original outlay doubles and then doubles again. It is the most patient form of pay rise there is.
This section uses Chancery Lane Research data as at 9th June 2026. The Rule of 72 is an approximation that assumes a steady rate of growth; real-world dividends rise and occasionally fall, so the figures are illustrative and the underlying yield-on-cost data should be confirmed before publication. Past dividend growth is not a guide to future income.
Book a no-obligation chat
020 7390 0670
Two hours, both spouses, no jargon, no pitch. We bring the coffee, you bring the questions and the pension statements. It is what it is, we are independent, agnostic and happy to talk.
About the author
Doug Brodie is Founder and CEO of Chancery Lane Income Planners. He has specialised in retirement income for over thirty years and is Chartered with both the CISI and CII. This article is general information and not personal advice. Tax rules can change, and the impact of any planning depends on your specific circumstances. Capital is at risk and past performance is not a guide to future returns.